
If you only read one thing: if a chart comes up blank, it is nearly always a number we do not have yet. Floor area, a target, an MPAN. Tell us the number and we will load it on.
01
Signing in and changing your password
We set your login up using the email address on your account. If you never got one, ask us and we will send it over.
- Open the link in your welcome email.
- Enter your work email and password.
- Click Sign Me In.
- To change your password, click the arrow next to your email address at the top right and choose Change Password.
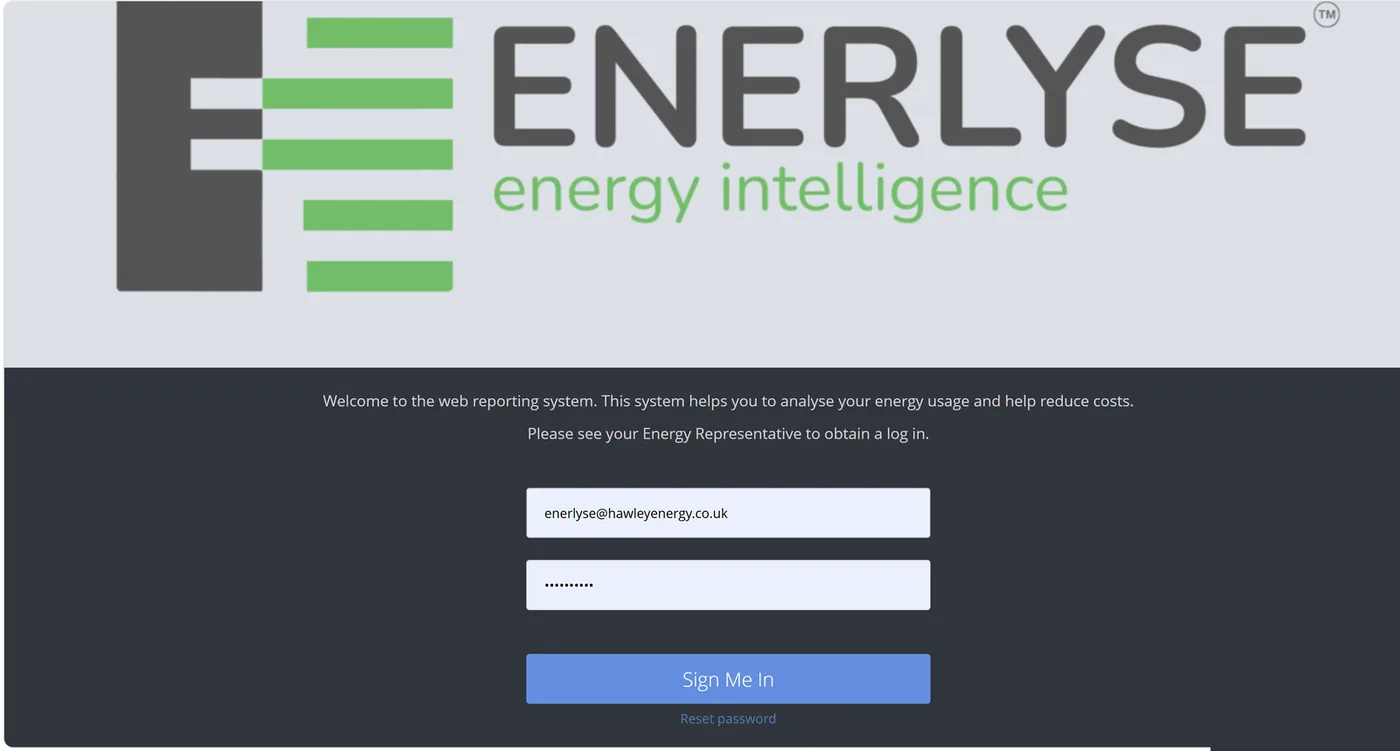
Worth knowing. If your password stops working, it is usually the browser holding on to an old one. Try a private window before you think anything has broken.
02
Finding your way around
The menu down the left side is the whole map. Three parts, and everything else hangs off them.
Click one and you land on its summary. From there you can open the dashboard, the reports and the alarms for whatever you have picked.
Groups
a region, a portfolio, a business unit
Sites
the buildings inside that group
Meters
the gas and electricity meters at each site
Every level has its own dashboard, reports and alarms. Group level tells you which building to look at. Meter level tells you what is wrong with it.
- Groups. A group is how your estate is organised. A region, a portfolio, a business unit.
- Sites. The individual buildings inside those groups.
- Meters. The gas and electricity meters at each site.
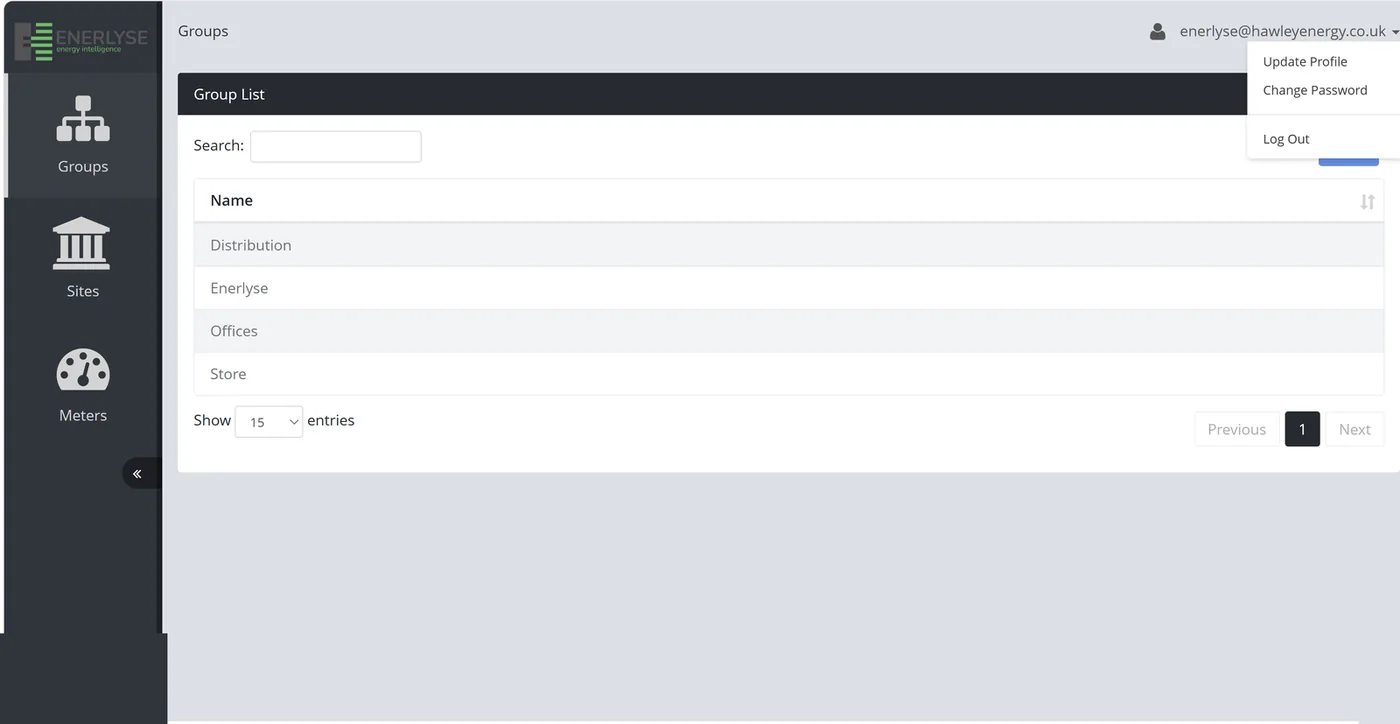
Search box. The search box on the Sites and Meters lists finds anything in the columns. Look up an MPAN, a postcode or a site name instead of scrolling.
03
Groups, sites and meters
The same numbers look different depending on where you stand. Start high and work down.
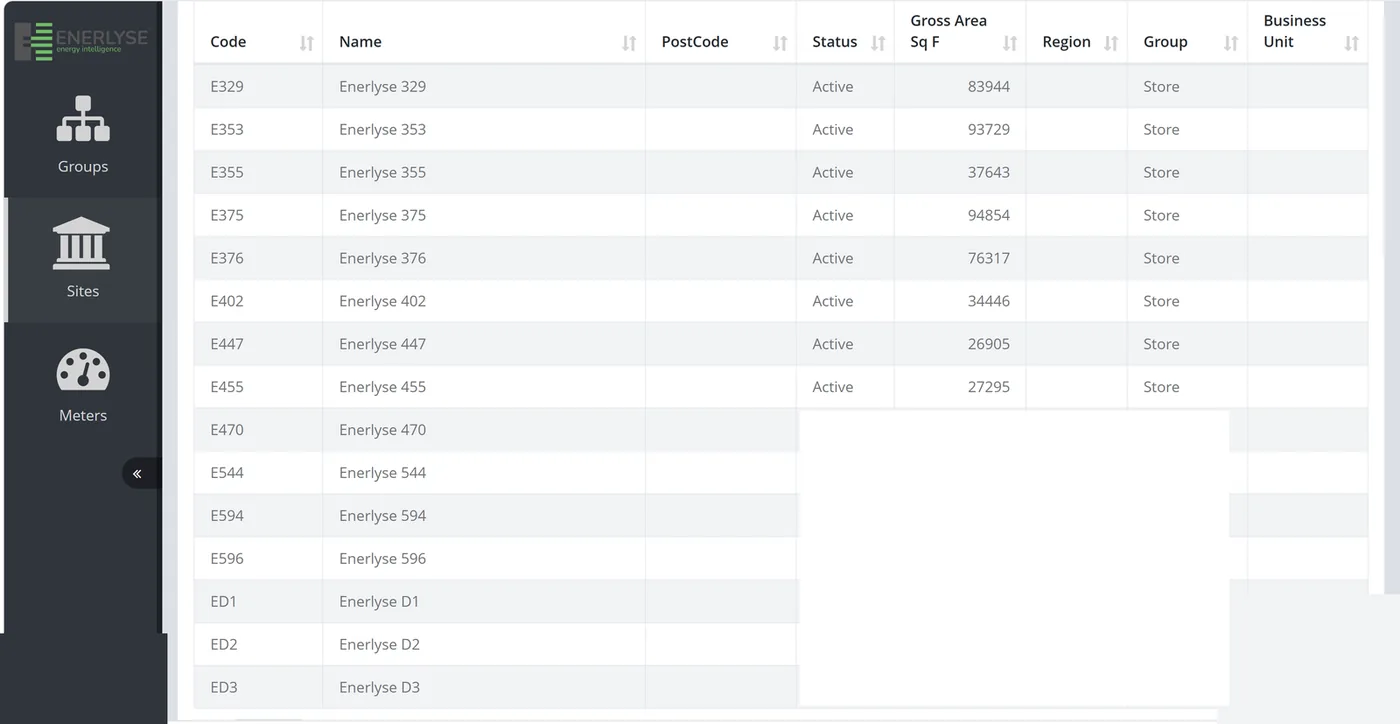
- Use the search box to find a value in any column. An MPAN, a postcode, part of a name.
- Click a row to open that site.
- The meters sit under the site. Each has its own reports, billing data and alarms.
04
Dashboards, league tables and targets
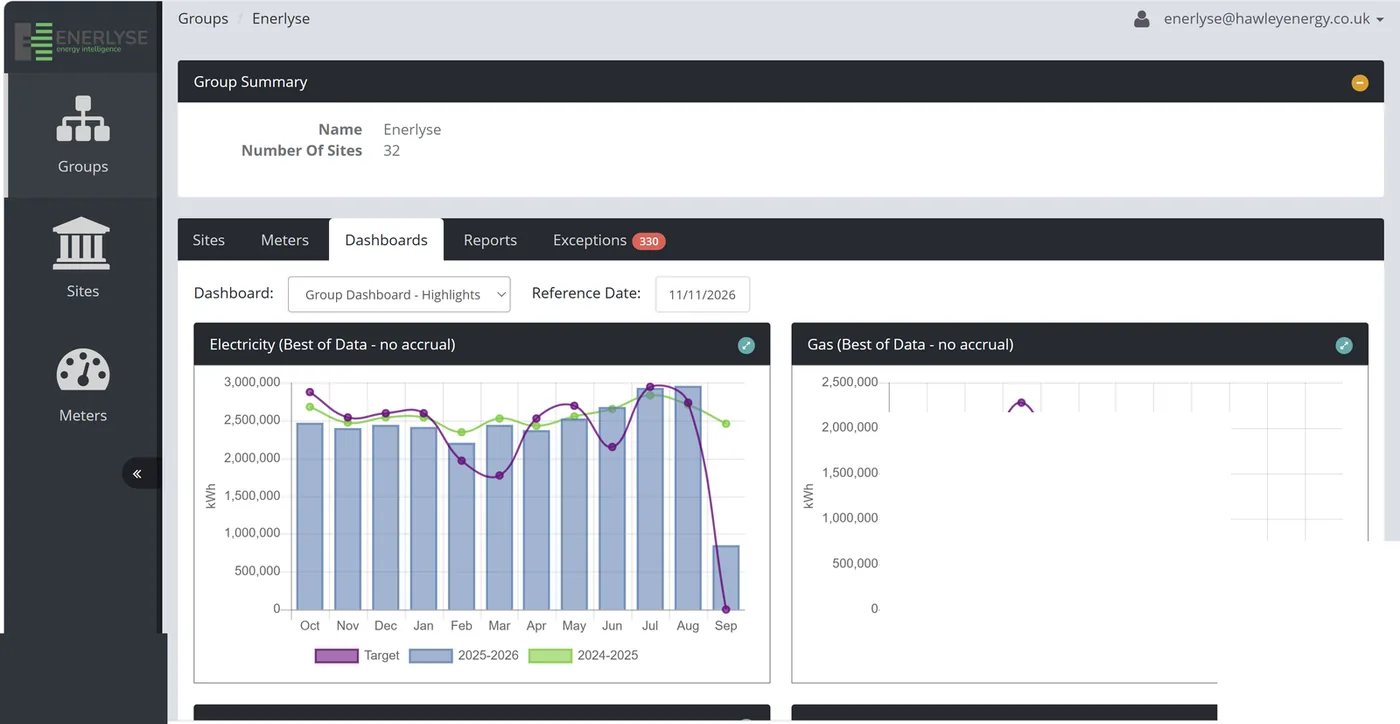
You can look at a dashboard for a whole group or for one building on its own. Open a site from the list and the dashboard is the first tab.
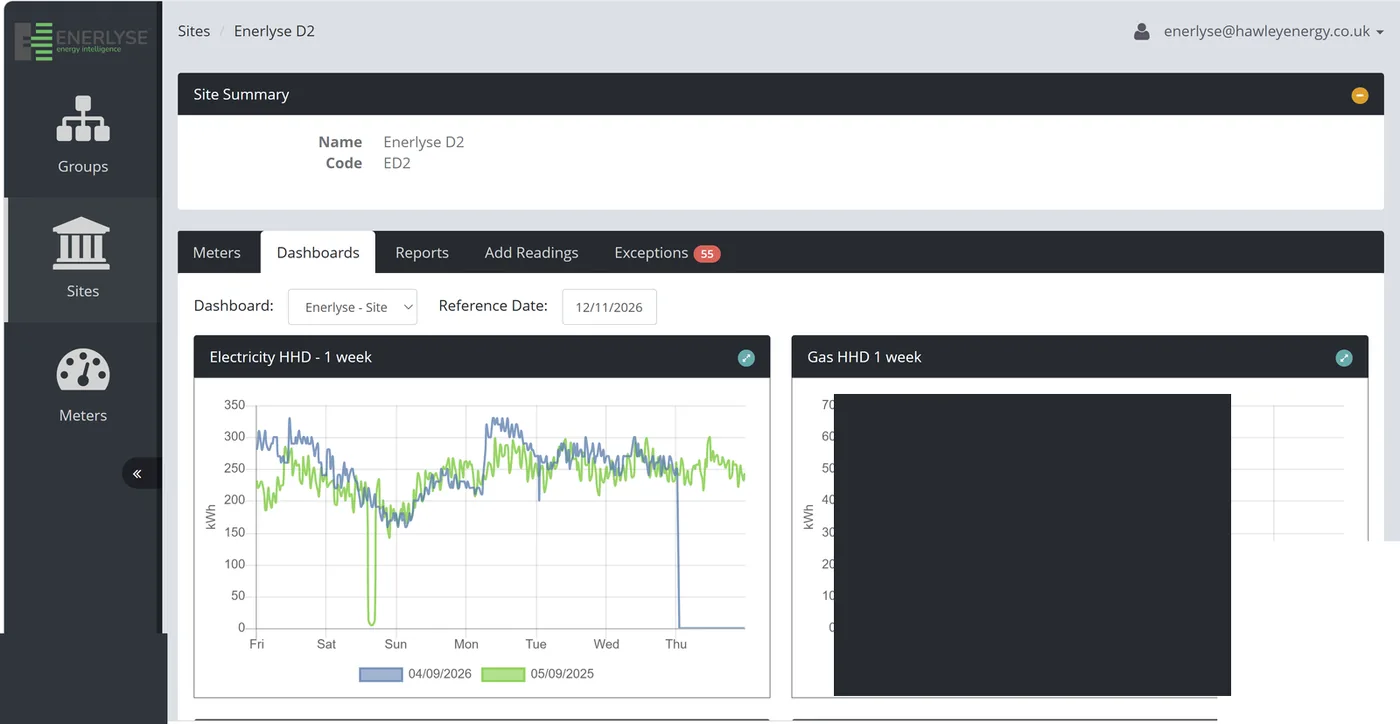
Most widgets use what the portal calls Best of Data. It takes the best data it has for that meter: half-hourly first, then invoice, then manual reads. Pin it to one source if you would rather.
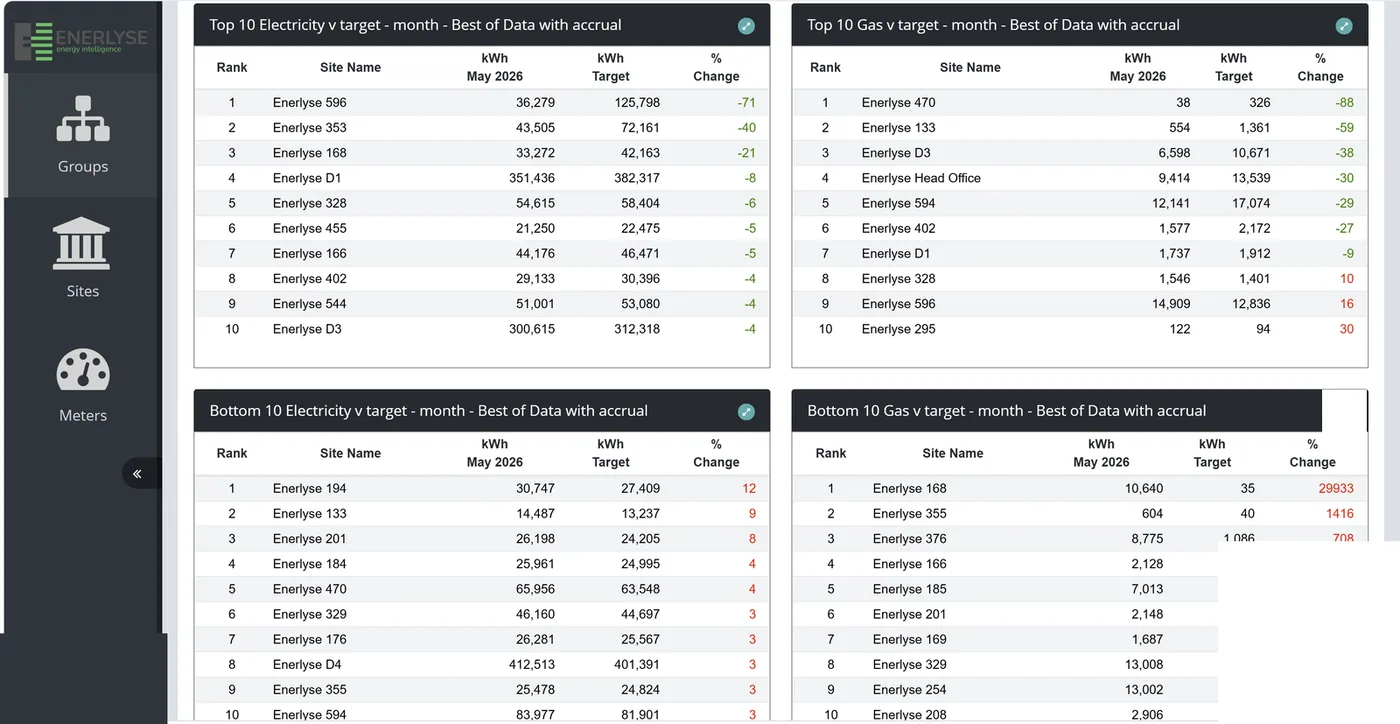
League tables
Rank every site against the others and against target, so the one out of step jumps out without you reading a chart.
Targets
A gauge or a target line only draws once that site has a target. Tell us the number and we will set it.
If a chart is empty
If a widget needs floor area, or another figure we do not hold, it will not draw until it is stored. That is a missing number, not a fault.
Dashboards can be built differently for different people. Your finance director lands on cost and budget, your facilities manager on consumption and alarms, and neither has to see the other one's view.
05
Exceptions and clearing an alarm
Where your meters send half-hourly data on their own, the portal can raise an alarm the moment the data lands and something looks wrong.
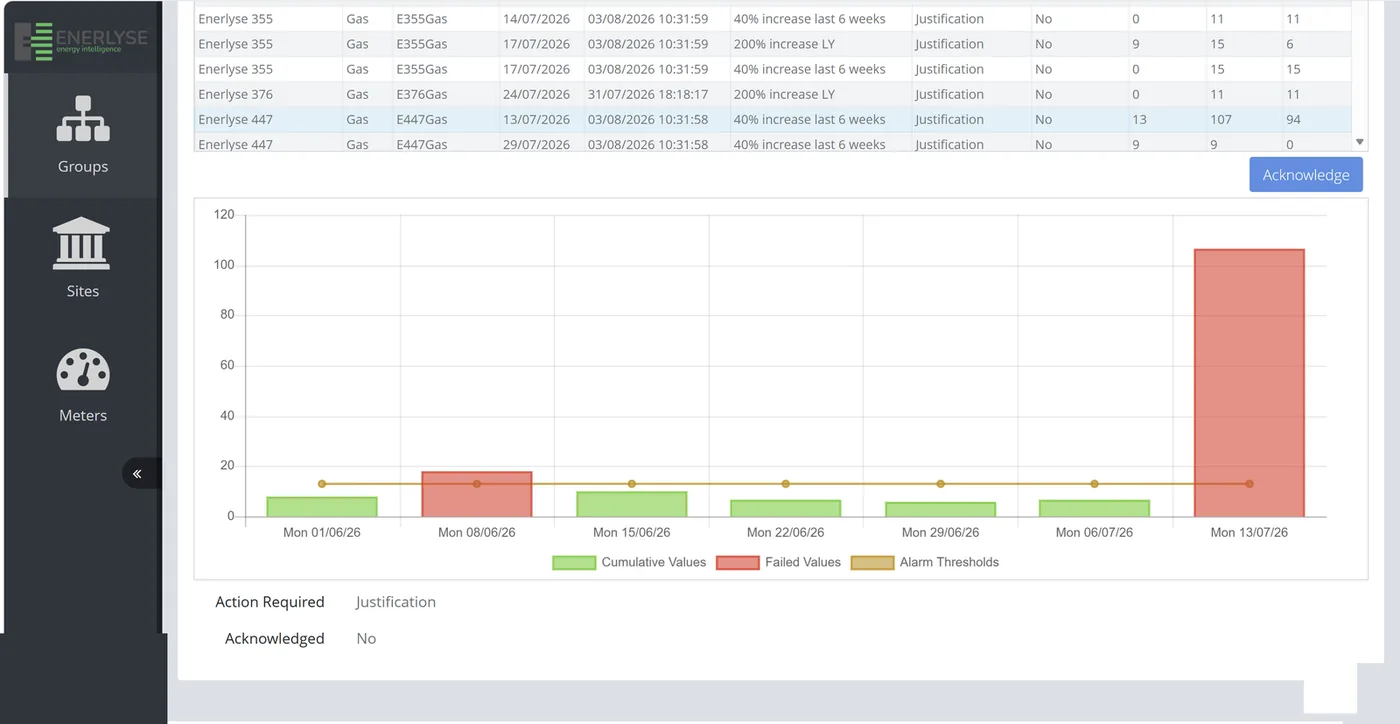
- Open the Exceptions tab for the group, site or meter you are looking at.
- Find the alarm you want to close.
- Click Acknowledge.
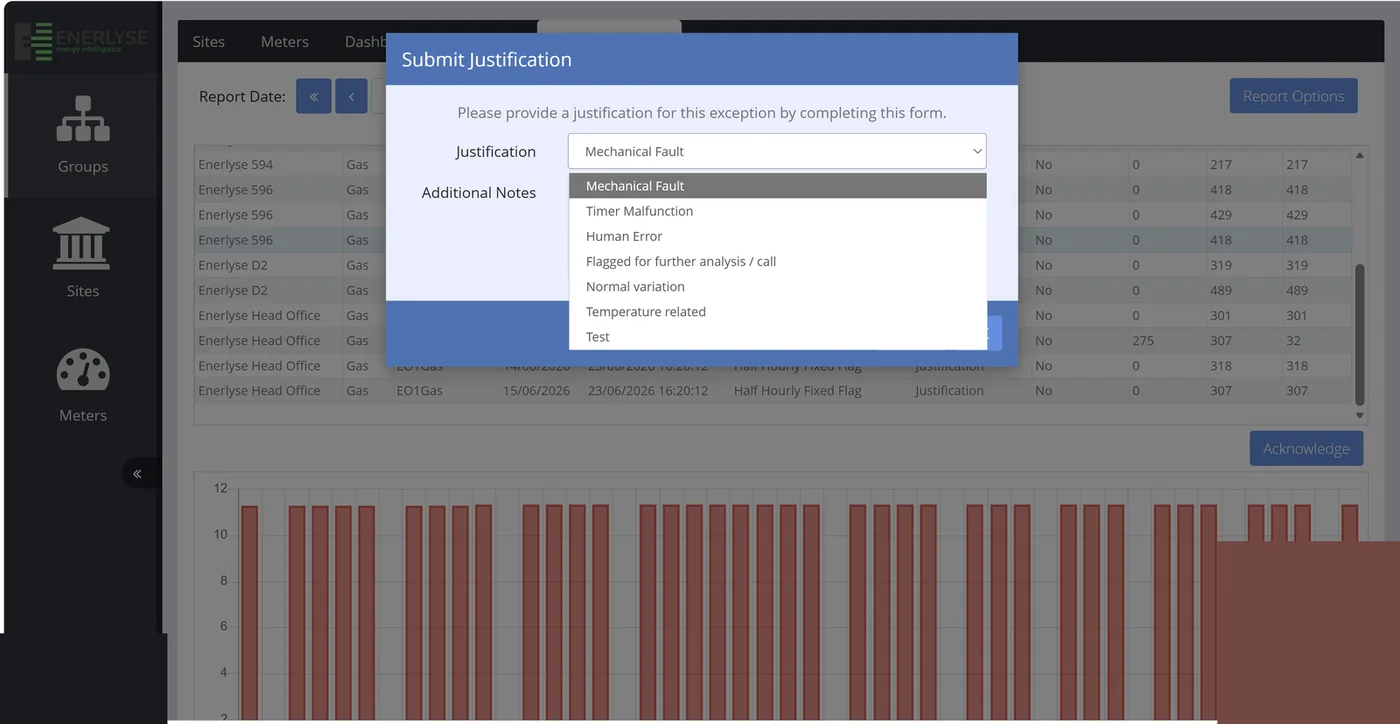
- Add a Justification and any notes. There is a dropdown of standard reasons and a free text box.
- Save. The alarm clears and the reason stays with it.
Our recommendation. Let our team work the alarms for you at the start. You get the handful that matter, with the reason already on them. If a pile of alarms need clearing at once, tell us which ones. We can do them in bulk at our end, which beats clicking through them one by one.
06
Reports and downloading data
There is a library of standard reports. Here is how to find them, and how to get half-hourly data out into Excel.
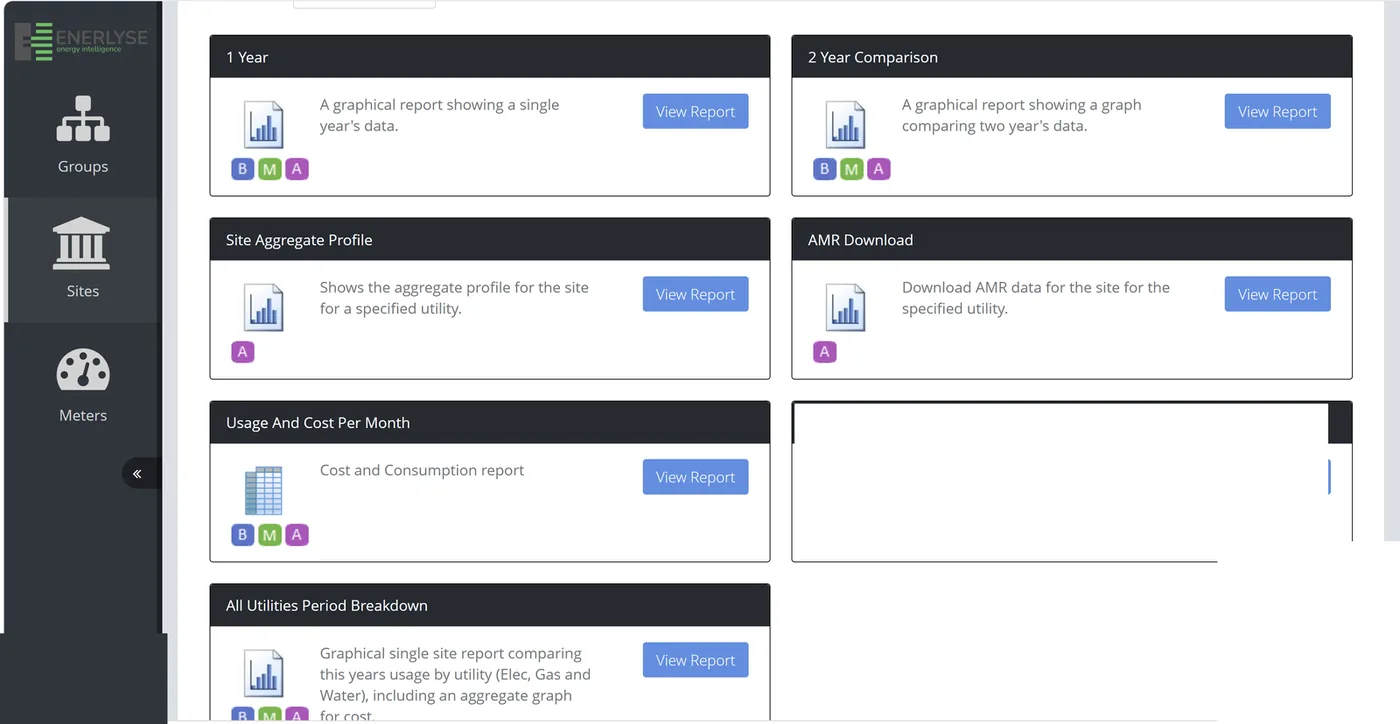
Available now. Year to date, year on year, site aggregate profile, usage and cost per month, and an all utilities breakdown for one site. If you need something else, ask.
Downloading AMR (half-hourly) data
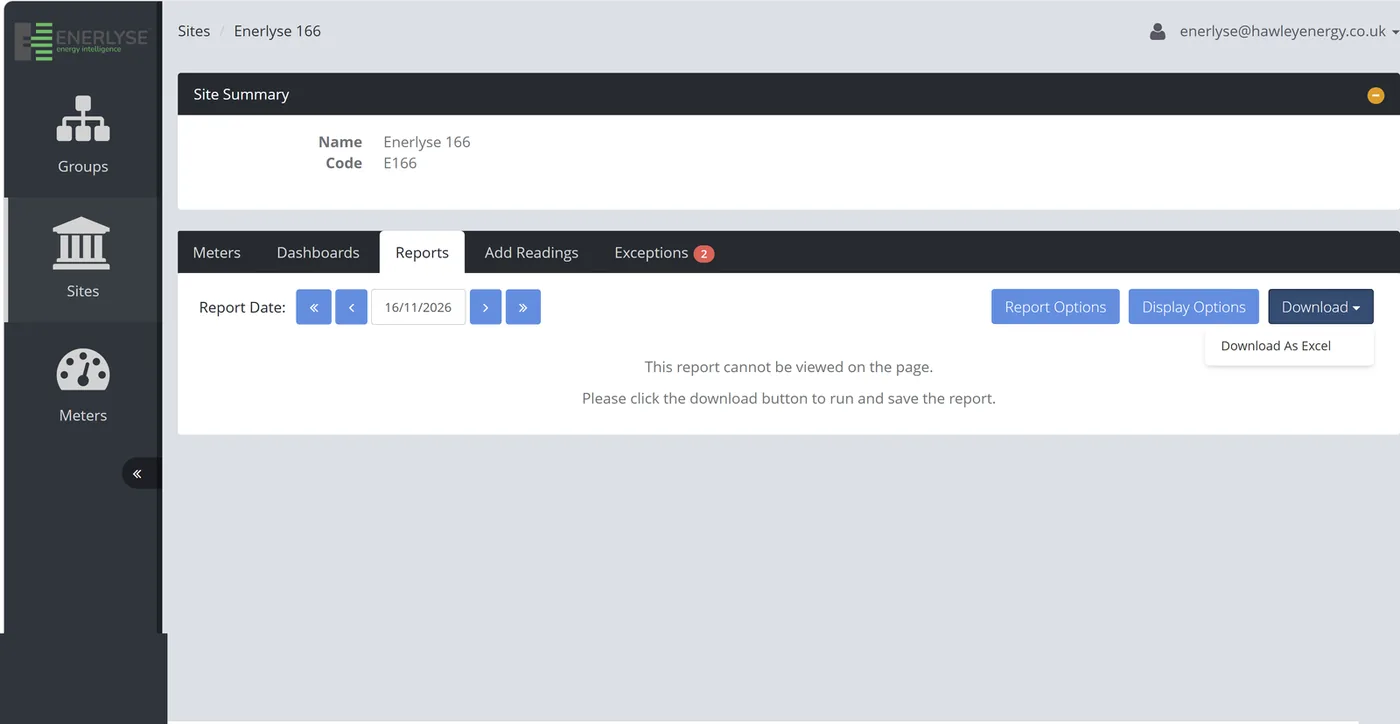
- Open the AMR download report. It is available by group, by site or by meter.
- In Report Options, choose the utility and the period you want.
- In Display Options, add any extra information you need in the output.
- Click Download, then Download as Excel.
- Open the file. The report itself is not shown on screen, it downloads straight to your machine.
07
The three kinds of data
Every meter can hold up to three sets of data and they are not the same thing. Knowing which one you are looking at explains most odd numbers people ring us about.
Profile
The half-hourly data that comes in from an AMR or smart meter, refreshed daily. This is the one you analyse, and the only one you can download in bulk.
Invoice
What the supplier billed. Good for cost and for checking a charge. Suppliers estimate a lot though, so a single month can sit over or under.
Direct
A reading somebody actually took on site. Right on the day, but taken a few times a year at best, so it cannot give you a year of profile.
Where a meter has all three, the portal has to pick one for a chart. That is all Best of Data means: profile first, then invoice, then direct. If a number has moved and nothing on site has, this is usually why.
Why it matters. A consumption figure from profile and a cost figure from invoice are two different things. Check which one you are looking at before you read anything into it.
08
Adding a reading by hand
Not every meter reports on its own. Where there is no AMR, a manual reading keeps the site up to date and lets the portal fill in between readings.
- Open Meters and select the meter.
- Choose the Add Readings tab.
- Enter the reading and the date it was taken.
- Save. The value appears under Manual Reading Data and is used wherever a direct reading is called for.
Past readings for the meter sit under Manual Reading Data, so you see the run of them rather than one number.
Worth knowing. Readings taken months apart cannot make a useful profile. If a site is on manual readings all year, talk to us about a meter. We fit extra meters and sub-meters where it pays.
09
Invoices and billing data
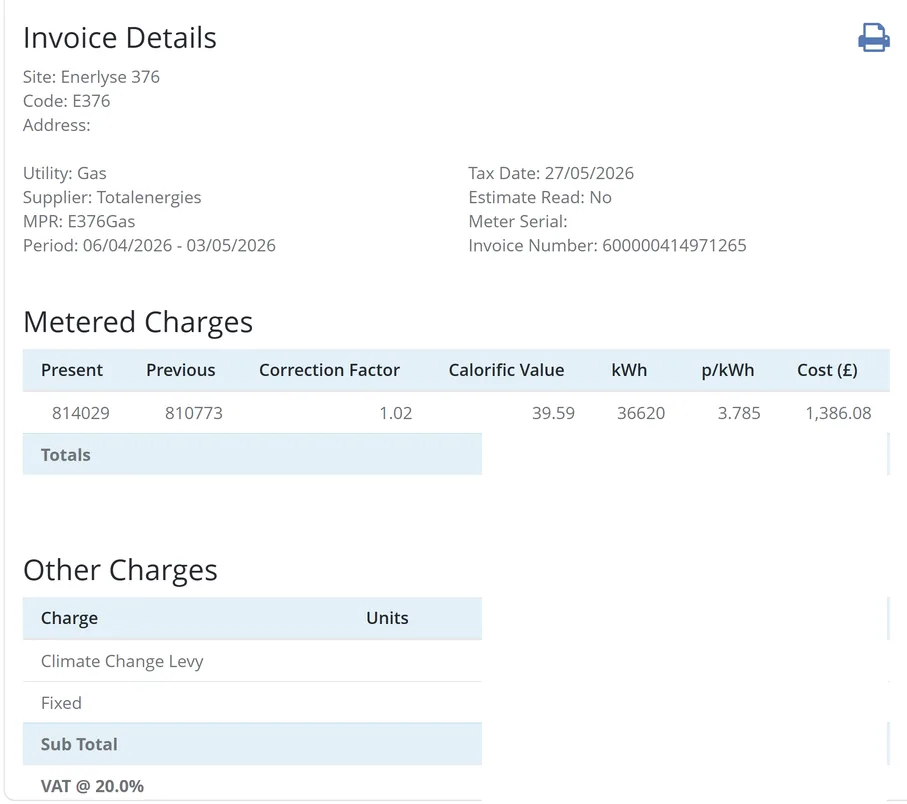
Invoice detail sits under the meter, not the site, and that is on purpose. It lets you take a consolidated bill apart back to the building it belongs to.
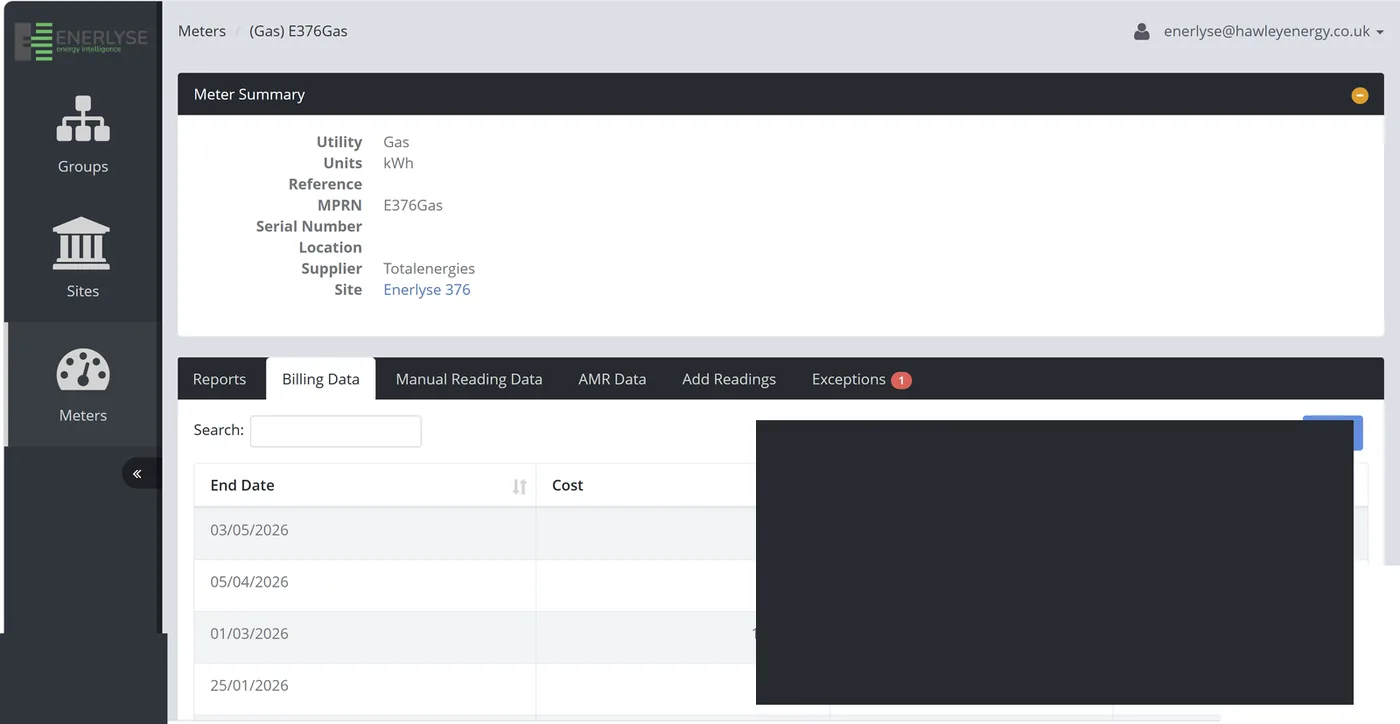
- Open Meters and select the meter you want.
- Choose Billing Data.
- Click the arrow button on the row you want to open the invoice.
10
Access, permissions and user views
Everyone gets their own login. What each one can reach is set by your administrator, not by us.
- Multiple users. Set a login up for everyone who needs one. There is no limit worth worrying about.
- Download rights. Bulk download of profile data is switched on or off per user. If someone is missing a Download button, that is usually why.
- Different views. Dashboards can be arranged per user, so each role lands on what it needs.
- New starters. Tell us when someone joins or leaves and we will set them up or close their access.
If a button has disappeared. Nearly always a permission rather than a fault. Email us and we will check what is set against your login.
11
If something looks wrong
Most questions are one of these four. Anything else, email us and we will take a look with you.
- A chart will not draw. Usually a figure we do not have, like floor area. Send us the number.
- The numbers look different from last month. Check which source the widget is on. Best of Data moves between profile, invoice and manual reads as they arrive.
- A meter is missing. The portal only shows meters we have been given. Send the MPAN or meter serial and we will add it.
- An alarm will not clear. It needs a justification before it will close. If the reason is not on the list, use the notes box.
Support
Email enerlysesupport@hawleyenergy.co.uk or call 01484 958761. If it is about a particular meter, send the MPAN or serial number and we can go straight to it.
12
Quick reference
| I want to go here | Where it lives |
|---|---|
| See a week of half-hourly use | Sites, open the site, Dashboards tab, set the Reference Date |
| Compare every site on cost | The ranking widget on the group dashboard |
| Check what a building was charged | Meters, select the meter, Billing Data |
| Open the actual invoice | Meters, Billing Data, then the arrow button on the row |
| Clear an alarm | Exceptions tab, Acknowledge, add a Justification |
| Pull half-hourly data into Excel | Reports, AMR Download, then Download as Excel |
| Find a meter by MPAN | Meters list, use the search box |
| Change my password | Arrow next to your email address, top right |
| Ask for a new widget or report | Email enerlysesupport@hawleyenergy.co.uk |
| Add a manual meter reading | Meters, Add Readings |
| Set a target for a site | Email enerlysesupport@hawleyenergy.co.uk |
| Get a login for a colleague | Email enerlysesupport@hawleyenergy.co.uk |
Support
enerlysesupport@hawleyenergy.co.uk
01484 958761
Send this and we can go straight to it: the site name and the MPAN or meter serial. A screenshot helps if it is a chart or a button playing up.
Enerlyse is Hawley Energy's energy monitoring, reporting and bill validation service.
PDF version 4, issued 17 November 2026. This online page is the same guide, kept to the same version.